No Single Cause for Late Cenozoic Cooling: Tectonic Uplift and Multiple Pathways of Climate Change
by Viet M. Bui for Geodynamics Final Essay
Introduction
Attempts to explain late Cenozoic cooling and the leading periods of major Pliocene glaciation have increasingly focused on whether tectonic activities occurred in the right place and the right time to match with climate signals recorded in benthic foraminifera δ^18 O records. This essay argues that late Cenozoic coolings were not the result of a single tectonic trigger, but of an ensemble of interacting mechanisms in which uplift of mountains altered the flow of atmospheric circulation, tectonically enhanced weathering that modified the carbon budget in the global atmosphere, ocean gateway reorganization changed heat exchange, and latest work has shown that mountain weather itself can back as both a sink and source of carbon dioxide, CO_2.
Kutzbach et al. 1989 works argued that the progressive uplift of major plateaus altered planetary waves, monsoon circulation and local wind fields by a series of sensitivity numerical experiments. The experiments using the model has characteristics that may limit accuracy. However, the works from Kutzbach and colleagues still shows the findings allow them to make qualitative comparisons and geologic evidence, and the linear response for the mechanics of kilometer-scale uplift has climatic consequences. In the second article, Raymo and Ruddiman 1992 extend the Kutzbach et al’s hypothesis into the long-term carbon cycle by involving the intensified erosion and silicate weathering over the past 40 million years (Mya) could have been the actor that lowering the atmospheric CO_2, and creating ideal environment for glaciation of the Pliocene take place. Contrasting to uplifting from the mountains and plateaus, closing of critical seaway such as the Indonesian due to the northward movement of New Guinea resulted in a cooler Indian Ocean is also consistent with the gradual late Pliocene rise in benthic δ^18 O near the 4 million year ago (Ma) (Cane and Molnar 2001). Later proxy work further refined the timing of Indonesian Throughflow restriction and linked it to late Pliocene climate shifts (Auer et al. 2019). Raymo and Ruddiman 1992 works listed a series of potential feedback on both positive and negative to explain for the CO_2 cycle briefly mentioned beyond the silicate weathering. They briefly mentioned about the organic carbon subcycle which could lead to more CO2 release until the recent work by Zondervan et al. 2023. They have shown that the uplift driven weathering cannot simply treated as a simple CO2 sink, because rock organic oxidation in rapid eroding mountain belts can offset, and a potential rival of the silicate weathering sink (Zondervan et al. 2023). Late Cenozoic cooling is therefore best understood not as the product of one tectonic cause, but as the outcome of multiple interacting pathways linking uplift, circulation, ocean gateways, weathering, and carbon cycle feedback.
Background
Oceanic Evidence:
Sedimentation in the deep sea is relatively continuous, ocean sediments provide the best long term record of global Cenozoic climate variation (Raymo and Ruddiman 1992). For this reason, the oxygen isotopic composition of marine calcite, especially benthic foraminiferal δ^18 O is considered as a first order proxy for past climate change. δ^18 O proxy is valuable because it is reflects continental ice volume and deep ocean temperature: growth of ice sheets enriches seawater in 〖^18〗O, while colder temperatures also increase the 〖^18〗O/^16 O ratio recorded in benthic calcite. (Raymo and Ruddiman 1992). The shells of marine organisms recovered from deep sea sediment cores preserve information about both ice volume and ocean temperature in the past.
Benthic foraminiferal δ^18 O as seen in Figure 1 (both in this essay and the original article) Raymo and Ruddiman based this figure from previous work by Miller et al. 1987 as a broad indicator of global Cenozoic climatic deterioration rather than as a purely regional Atlantic signal. Compilation for Atlantic is much broader and contained the full scope of the Cenozoic era compared to the Pacific compilation (Miller et al. 1987). The curve shows a long-term increase in δ^18 O spanning 70 Myr, interrupted by 2 major steps. They interpret the rise in the early Oligocene (~36 Myr) (Figure 1), as the first major Antarctic ice growth event, while later increases in the middle Miocene and late Pliocene indicate further expansion of Antarctic and Northern Hemisphere ice volume (Figure 1).
The author usage of Figure 1 provides good the climatic background for readers and leading them to their larger argument: late Cenozoic cooling was not a short, isolated event, but a long-term trend with threshold like steps that tectonic mechanisms at the right place and time might help explain.
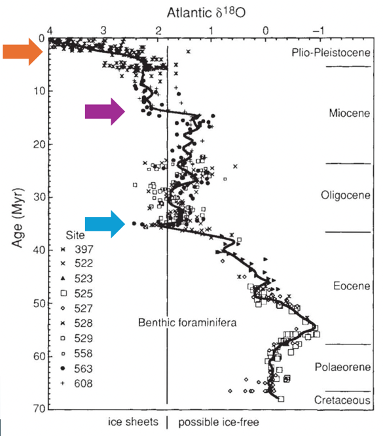
Figure 1. Compilation of benthic delta 18 O measurements from Deep Sea Drilling Program sites spanning the past 70 Myr. Modified from Raymon & Ruddiman 1992 figure where orange, purple, and blue arrows added to highlight major steps about long-term increase in delta 18O reflects cooling periods of the deep ocean temperature and growth of icesheet in high latitude where ice volume still remains uncertain (Raymo & Ruddiman 1992). Orange: transition between Miocene and Pliocene ~4Myr. Purple: mid Miocene step ~15Myr. Blue: transition between Eocene to Oligocene ~35Myr.
Terrestrial Evidence:
Terrestrial evidence broadly supports the long-term climatic deterioration inferred from marine δ^18 O records, but it also shows that late Cenozoic cooling involved strong regional differentiation rather than simple uniform cooling. In Alaska, subtropical Paleocene flora gave way to temperate vegetation by the middle Oligocene and to an essentially modern flora by the Pliocene, while faunal evidence from Ellesmere Island and fossil pollen from Antarctica and Australia further suggest progressive cooling at high northern and southern latitudes (Raymo and Ruddiman 1992). More generally, they argue that the paleobotanical evidence records a shift from equable, moist early and middle Cenozoic climates to increasingly differentiated cold versus warm and dry versus wet climatic patterns in the Northern Hemisphere. Cane and Molnar then add a more focused East African record, showing that warm, moist environments persisted before about 4 Ma, but that by 2.95 to 2.32 Ma the Omo region underwent a marked transition from forest associated taxa to mesic woodland and finally to dry savanna and steppe assemblages. Altogether, these terrestrial records further support the view that late Cenozoic climate change was both progressive and regionally structured, providing an important observational background for later tectonic explanations based on uplift and ocean gateway reorganization.
Topographic Forcing of the Atmosphere and Climate
Physical:
Raymo and Ruddiman place the Tibetan Plateau at the center of the uplift hypothesis because, in their words, it has a mean elevation of almost five kilometers and an area roughly half the size of the United States, making it the most imposing topographic feature on Earth. The importance of Tibet is heavily emphasized, and the region is not simply its height, but the claim that a plateau of this massive scale can enhanced and intensify the infamous Asian monsoon and perturb atmospheric circulation across much of the Northern Hemisphere. In this view, topography becomes a climate forcing mechanism: plateau uplift changes winds, pressure fields, vertical circulation, and eventually the regional distribution of temperature and precipitation (Raymo and Ruddiman 1992).
The review works in Raymo and Ruddiman cited the Kutzbach et al. 1989’s numerical experiment. The method is ideal to just testing whether imposing topographic feature such as major plateaus such as the Tibetan and the American West could redirect the circulation wind in such way that with given seasons. The strength of this method was that it isolated uplift as a single forcing variable, but the limitation was that several other boundary conditions were held fixed. The author note that the model used perpetual January and July solar radiation and prescribed sea surface temperature, sea ice, snow cover, and soil moisture choices that may constrain the full magnitude of climatic sensitivity to uplift. his simplified design was useful precisely because it allowed them to trace the atmospheric response directly to changing orography.
Chemical:
Raymo and Ruddiman ask how uplift might also produce global cooling of the necessary magnitude, and their theory is leading to additional factors. The factors are leaning toward chemical weathering to explain for the global Cenozoic cooling. Given the change in important greenhouse gasses, atmospheric CO_2, can alter the global climate. The authors note that with the long timescale the balance between CO_2 level and volcanic out gassing and the rate of chemical weathering of rock on the surface, which can be simplified into
CaSiO_3+CO_2 □(→┴(chemical weathering) ) CaCO_3+SiO_2
and vice versa through metamorphism,
CaCO_3+SiO_2 □(→┴metamorphism ) CaSiO_3+CO_2
When reviewing the model of CO2 input through metamorphism and decarbonation reactions and output through chemical weathering of the atmosphere over the past 100 Myr. The initial chemical model design, reviewed in Raymo and Ruddiman 1992, however produced mismatch that a possible explanation need to involve another CO_2 model that focus on the erosion-driven component. Using the modern river studies from previous work of the same author, Raymo shows that the long-term removal of the CO_2 from the atmosphere can be also achieved by continental relief rather than area and temperature on atmosphere is a weak control on chemical erosion rates. In mountainous regions, dominated by rapid physical erosion increasing the surface area of fresh mineral ready to be attacked by chemical processes. The positive feedback from steep slope flushing away physical and chemical erosion products constantly creating negative feedback for drawing out CO_2 from the atmosphere.
Critical Seaway Reorganization and Late Cenozoic Climate
Tectonic climate hypotheses proposed alternative or additional background mechanics which are on critical seaways. Raymo and Ruddiman note that the separation of Antarctica from South America and Australia was a cause of the cooling for Antarctica by the development of the circum-Antarctic current and thermal isolation. Also, the assumption that stronger pre-separation meridional heat transport kept sea surface temperature around Antarctica too warm for large ice sheet to form. However, this picture is complicated by circulation experiments suggesting stronger heat transport could instead promote more precipitation leading to larger snowfall accumulation over polar regions. Another view, the closing of critical seaway such as the Isthmus of Panama predates well with the Northern Hemisphere glaciation with appropriate timing of 0.5 to 2 Myr, making the north Pacific deprived of warm ocean current from the Caribbean and the Atlantic. This picture of Panama cooling and the magnitude of the cooling is still unclear. Cane and Molnar 2001 have a different idea, and it is going back to the Indian Ocean, Australia area. The authors redirected our attention to Indonesian seaway closure causing by the northward movement 70km/Myr of New Guinea island (referring to the modern island of Indonesia and Papua New Guinea). 3-5 Myr, the island was 2-3 degree south of its current position. The movement had been narrowing the seaway that altering the flowthrough region switching from warm ocean current from the South Pacific to a much cooler currents from North Pacific, leading to the aridification in East Africa reflecting through the terrestrial evidence and influenced the evolution of hominids. They also provided the slow tectonic forcing that consistent with the gradual rise in benthic δ^18 O near 4Ma earlier than the abruption glaciation at about 2.75 Ma (orange arrow in Figure 1).
Methods:
Tracing back to the Kutzbach et al. 1989, their approach on this problem with a numerical sensitivity test using General Circulation Model (GCM) specifically the Community Climate Model (CCM). The design of the experiments was simple: by changing only orography and compared across 3 states, a no mountain (noted as NM), a half mountain (HM), and a full mountain (M) case. The experiment was not a fully paleoclimate reconstructions but rather a controlled tests of atmospheric effect onto climate due to progressive uplift (Kutzbach et al. 1989).
For the chemical modeling of the CO_2, BLAG model was employed by relating the flux of CO2 in the atmosphere linearly to the rate of seafloor production and subduction and the output of the CO_2flux from the atmosphere to the area of continents for chemical weathering. To compensate, they compensate the long-term removal of CO_2from the atmosphere through the basis of modern river studies using data from the 8 largest rivers draining in the Himalayan-Tibetan region.
Cane and Molnar combined tectonic reconstruction of eastern Indonesian gateway geometry with an analytic equatorial ocean model based on linear shallow water theory and geostrophic wave dynamics. They then linked this idealized ocean mechanism to published ocean GCM experiments showing that a more southerly New Guinea configuration would have produced Indian Ocean temperatures changes at 100 m depth and finally evaluated the climatic relevance of that temperature change using modern observations and atmospheric model studies relating Indian Ocean sea surface temperatures (SST) to East African rainfall.
Results:
Although simplified by design, the sensitivity experiments produced agreeable climate patterns that fit the temperature and precipitation changes inferred by geologist and paleobotanists occurred over the past 40 Myr. Kutzbach et al. found that atmospheric heating rates, 500 mbar vertical motion, and 250 mbar stationary eddy geopotential height all varied roughly linearly from the no mountain to half mountain to full mountain experiments. In January, stationary planetary wave amplitude increased progressively with orographic height, while in July the uplift strengthened monsoon lows over southern Asia and southwest North America. This is the core of the topographic forcing argument: uplift does not merely cool mountain tops locally; it redirects circulation patterns over much larger areas.
The Tibetan Plateau also acts in the model as a seasonal thermal engine. Raymo and Ruddiman emphasize that the plateau’s height and breadth help drive a regionally intense monsoon circulation, and Kutzbach et al. quantify this through heating and vertical motion over the plateau. To investigate the atmospheric heat sources and sinks over the plateaus, Kutzback and colleagues quantified by the net vertically integrated heating rate Q, which is the sum of net radiative heating R, sensible heating S, and latent heating from precipitation LP. These values are shown in Table 1 (Table 2 from original Kutzbach et al 1989).
Over Tibet, the model produces a large positive net atmospheric heating rate in agreement with previous study of the same area during July for the Q = 150 W/m^2, and fair linear increase for 3 cases pointing to the positive correlation with progressive uplift hypothesis. Kutzbach et al and Raymo & Ruddiman 1992 therefore conclude that plateau uplift can produce geographically coherent changes in atmospheric circulation through three linked processes: stronger orographic diversion of the westerlies, stronger seasonal cyclonic and anticyclonic circulation around the plateaus, and intensified vertical motion in large scale east west atmospheric cells. Their broader conclusion is that uplift was an important forcing function of late Cenozoic climate change, although they also acknowledge that the simulated high latitude cooling was too modest to explain full Plio-Pleistocene glaciation on uplift alone. This is why the topographic hypothesis is best treated as a major part of the explanation rather than a complete explanation by itself.
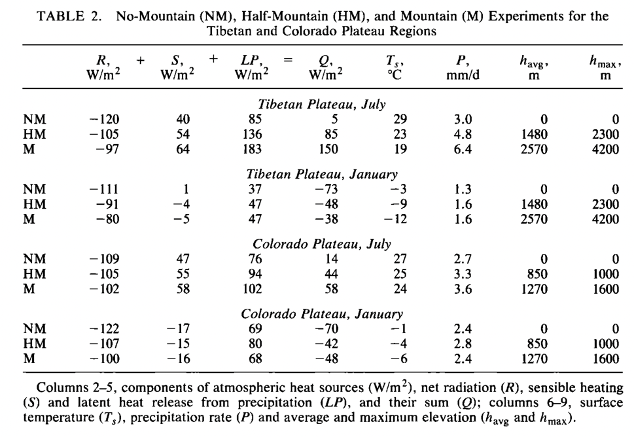
Table 1. Citing Table 2 from (Kutzbach et al. 1989)
The possible region that responsible are noted by the author and they point back to the Himalaya and the formation of the Tibet plateau where the combination of incident solar radiation drives the strong atmospheric convection creating the intense Asian monsoon backed by the Kutzbach et al. 1989. It is amazing that such a small area 5% of the Earth’s land surface is responsible for 25% of the total load reaching the ocean, as remarked by Raymo and Ruddiman. The authors proposed the timing for the creation of Himalaya and Tibet plateau and the drawing down of CO_2was during the post Eocene, explained for the rapid cooling for the blue arrow in Figure 1.
However, the model from the author then needs the employment of weathering proxy, Strontium isotope record in marine carbonates to test the predictions. As shown in Figure 2 in Raymo & Ruddiman 1992, the seawater 87Sr/86Sr ratio record reflect the balance between input of radiogenic material weathered from continent and non-radiogenic material introduced by hydrothermal activity (from seafloor). The authors pointed out that the carbonate weathering such as from the metamorphic of the Himalayas would result in higher flux of reiver strontium compared to silicate weathering which typically results in low flux of strontium. Of course, the third source of strontium is from the redissolution of marine carbonate. In Figure 2, the relatively linear trend of increase in strontium ratio could be due to the delivery from land or decrease in sea floor hydrothermal activity. Because of the relationship of seafloor spreading rate can be estimated from marine magnetics anomalies, the author points out that such little change of spreading rate over the past 30-40 Myr, they can safely say that the increase in strontium ratio can be explained by the increase in the runoff from land. Therefore, from the Raymo & Ruddiman study and other previous studies concur the erosion in the Himalaya has been the actor for the significant fraction of the observed increase in strontium ratio. They highlight that complication from the variation and the need for better proxy just for silicate component of weather would be the key to refine and redefine the global weathering rates in the geological past.
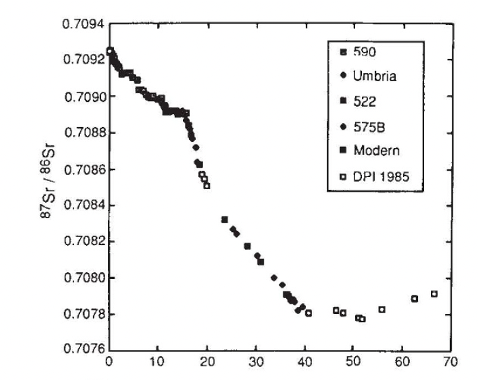
Figure 2: Strontium isotopic composition of sea water for the past (Figure 2a in Raymo and Ruddiman 1992)
Raymo and Ruddiman made tectonic uplift and carbon cycle as one of the causes then Cane and Molnar’s central finding is that progressive restriction of the Indonesian seaway could have altered global climate by changing the source waters of the Indonesian Throughflow from warm South Pacific to cooler North Pacific water. Ocean model results indicate that, before this restriction, temperatures at 100m depth in the central Indian Ocean were about 2 degrees Celsius warmer, with local anomalies reaching above 2. Because warmer Indian Ocean conditions are associated with greater East African rainfall, Cane and Molnar admitted that they could not asset how true this was, but they argue that this tectonic reorganization plausibly contributed to East African aridification period. They further argue that the mechanism fits the timing of late Pliocene climate change, because benthic δ^18 O rises gradually from ~4 Myr ago whereas widespread Northern Hemisphere glaciation begins more abruptly later, a pattern consistent with slow tectonic forcing followed by threshold like ice sheet growth.
Discussion:
The background of seaway closure remains important because later work has strengthened Cane and Molnar’s original argument. Auer et al. 2019 refined this timing with a multiproxy record from International Oceanic Drilling Program (IODP) Site U1463 on the northwest shelf of Australia spanning about 3.65 to 2.97 Ma. Using sediment geochemistry, calcareous nannofossils, and X ray fluorescence data, they argued that Indonesian Throughflow restriction culminated at ~3.54 Ma, when cooler, fresher northern source waters replaced warmer tropical Pacific inputs, and that this reorganization increased the sensitivity of the Indian Ocean to cooling, leading in the glaciation event ~3.3 Ma. Figure 3 shows a better resolution evolution of the flowthrough region going from >3.54 Ma (Figure 3a), where much of the New Guinea are not present and the current could going through exchange heat from the Pacific Ocean to Indian ocean or the alternative route from more opened sea in the northwest of the island. Figure 3b-c showing the new land coverages (red shade) appears and potential restriction happening organized much of the warm currents from the Pacific and finally Figure 3d is our present-day condition. In this sense, Auer et al. do not simply repeat Cane and Molnar’s hypothesis but provide a more tightly constrained palaeoceanographic framework showing how Indonesian gateway restriction could have amplified late Pliocene cooling through changes in Pacific Indian Ocean heat exchange.
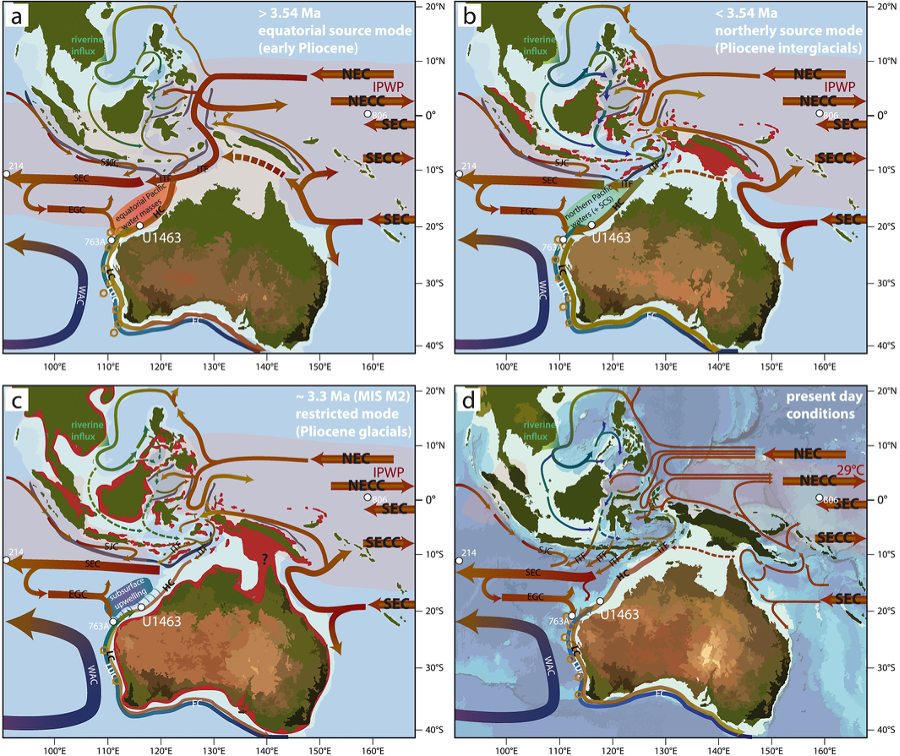
Figure 3: Timing and Pacing of Indonesian Throughflow Restriction and Its Connection to Late Pliocene Climate Shifts (Auer et al. 2019) This timing and reconstruction enhanced the claim from Cane and Molnar 2001’s picture.
Within Raymo and Ruddiman article, they have already recognized the weathering hypothesis created a carbon cycle imbalance and briefly invoked the organic carbon (OC) “subcycle” as additional possible feedback that could add more CO_2back into the ocean-atmosphere system if OC burial declined through time. However, it is remained unresolved that this OC term were mainly a secondary feedback, hence the word “subcycle”, not as quantitative constrained rival to silicate weathering. Zondervan et al. 2023 close much of that gap by directly estimating flux from rock organic carbon oxidation using dissolved rhenium as proxy, calibrated with 59 global distributed river basins. Their central finding is that oxidation of petrogenic organic carbon (OC_petro) released about ~68 megatons of carbon per year (MtC/yr) to the atmosphere, a flux concentrated in hotspot. These hotspot are correlated with regions that undergoing rapid uplifting (mountain belts) such as the Himalayas, the Rocky Mountains, and the Andes (Zondervan et al. 2023) with river basins connecting to them inferring from the data to suggest so. This is not a minor correction since they show that the flux is comparable to global terrestrial CO2 uptake by silicate weathering, estimated to be 94-143 MtC/yr while the net transfer of carbon to the lithosphere by silicate weathering is only 47-72 MtC/yr. With that logic the organic carbon subcycle in previous work is no longer secondary feedback but rather a process that could offset and, in some case, become a rival with the sink from silicate weathering. Given the work from Zondervan, the understanding of the dynamics of Earth’s weathering need to be reimagined to account for variation in all these new fluxes and because we still need a full picture of their relative importance to have a more well connected caused leading to the step coolings of the Cenozoic era.
Conclusion
These studies are the exhausted effort of many scientists coming from interdisciplinary fields that building somewhat on each other to show how late Cenozoic cooling can be explained. Their results are best understood as the multiple interacting tectonic pathways rather than a singular trigger. Progressive uplift forming mountain and plateaus reorganized atmospheric circulation, amplified planetary waves, and intensified monsoonal contrasts (Kutzbach et al. 1989), while the extension to this understanding into the long-term carbon cycle through the enhancement of the chemical weathering drawing out the atmospheric CO_2(Raymo and Ruddiman 1992). At the same time, ocean gateway closure/restriction likely altered ocean heat exchange preconditioned the environment for the right late Pliocene glaciation event (Cane and Molnar 2001), strengthened with paleo reconstruction images around this time further strengthen their mechanism claim (Auer et al. 2019). Newwer understanding in rock carbon cycle picture also show that the organic carbon sub cycle is not so “sub” as previously mentioned. As rock organic carbon oxidation in rapidly uplifting mountain belts can rival the silicate weathering sink, meaning that tectonic climate forcing must be understood through a more complete geological carbon cycle framework than earlier uplift models assumed (Zondervan et al. 2023). This is especially important in rapidly uplifting mountain belts such as the Himalaya, where the same tectonic processes that expose fresh silicates also expose petrogenic organic carbon, creating the possibility of both CO_2drawdown and CO_2release within the same orogenic system.
References:
-
Auer, Gerald, David De Vleeschouwer, Rebecca A. Smith, et al. 2019. “Timing and Pacing of Indonesian Throughflow Restriction and Its Connection to Late Pliocene Climate Shifts.” Paleoceanography and Paleoclimatology 34 (4): 635–57. https://doi.org/10.1029/2018PA003512.
-
Cane, Mark A., and Peter Molnar. 2001. “Closing of the Indonesian Seaway as a Precursor to East African Aridification around 3–4 Million Years Ago.” Nature 411 (6834): 157–62. https://doi.org/10.1038/35075500.
-
Kutzbach, J. E., P. J. Guetter, W. F. Ruddiman, and W. L. Prell. 1989. “Sensitivity of Climate to Late Cenozoic Uplift in Southern Asia and the American West: Numerical Experiments.” Journal of Geophysical Research: Atmospheres 94 (D15): 18393–407. https://doi.org/10.1029/JD094iD15p18393.
-
Miller, Kenneth G., Richard G. Fairbanks, and Gregory S. Mountain. 1987. “Tertiary Oxygen Isotope Synthesis, Sea Level History, and Continental Margin Erosion.” Paleoceanography 2 (1): 1–19. https://doi.org/10.1029/PA002i001p00001.
-
Raymo, M. E., and W. F. Ruddiman. 1992. “Tectonic Forcing of Late Cenozoic Climate.” Nature 359 (6391): 117–22. https://doi.org/10.1038/359117a0.
-
Zondervan, Jesse R., Robert G. Hilton, Mathieu Dellinger, Fiona J. Clubb, Tobias Roylands, and Mateja Ogrič. 2023. “Rock Organic Carbon Oxidation CO2 Release Offsets Silicate Weathering Sink.” Nature 623 (7986): 329–33. https://doi.org/10.1038/s41586-023-06581-9.